The Best Tools for Measuring Page Speed

If you’re finding that your website is super slow, especially on mobile, then chances are that it’s not just you that’s getting annoyed – your customers will be too.
Monitoring how fast your important webpages are over time can really help improve your search engine rankings, conversions and revenue for your business.
So, what are the page speed best tools? Let’s take a look at some of the top tools I recommend below…
Why is page speed important?
Page speed is really important for a few reasons:
- Google’s algorithm considers how fast pages are when assessing where to rank certain webpages for specific keywords. A faster website that your competitors could mean the difference in one position, but that one position could mean the difference of a 20% CTR or a 34% CTR from search results. No one wants to turn that level of traffic.
- Mobile devices have exploded in use over the past decade or so, and it’s likely to see future growth too. With mobile device users not always being connected to WIFI connection, it’s really important that your webpages are optimised to perform as fast a possible for 3G and 4G connections.
- Brand awareness and loyalty. If potential customers are arriving to your website and they are repeatedly experiencing a very slow page speed, then this could damage your brand and potential for future repeat purchases. High bounce rates can lead to your potential customers to leave your website and visit a competitor website.
The best tools for monitoring page speed
Here are the page speed monitoring tools we regularly use at QueryClick to keep an eye on performance.
Plus, a few extra tools that could bring a lot of additional value to your business.
GTMetrix
This is a staple page speed tool that I’ve been using for a few years now.
GTMetrix is great for:
- Monitoring page speed metrics over time, daily, weekly or monthly
- Creating email alerts for page speed budgeting issues
- Setting testing locations e.g. London, Sydney, Tokyo
- Test for mobile or desktop with most used browser types available
- Connection type e.g. 3G or Broadband connection
Google has not long ago launched Core Web Vitals as part of their overall Page Experience metrics.
GTMetrix have also updated their tool to help us all monitoring Core Web Vital metrics which include:
- LCP (Largest Contentful Paint) – which measures loading and how fast your page appears visibly load
- TBT (Total Blocking Time) – Interactivity of the website and how usable your page is while loading
- CLS (Cumulative Layout Shift) – measures visual stability of elements on the page when a webpage is loading
GTMetrix is great for us to share results of our page speed performance optimisations with our clients. Whether it be a CMS migration testing UAT or PROD environments and testing in live after launch of sprint cycles.
GTMetrix is very reliable and hasn’t let us down to date. I’d highly recommend the tool if you’re looking to start tracking performance. The monthly cost is reasonable and in my opinion, definitely worth it.
Google Page Speed Insights
Another page speed tool that we use sporadically alongside GTMetrix is Google’s tool, Page Speed Insights.
Page Speed Insights is great for:
- quick sense checks
- benchmarking against your competitors. Particularly great for a top level view and snapshot of performance.
The way we use Google Page Speed Insights is via testing on a browser or API data to a Google Sheet.
Using the browser version is great, however only gives you a view of just one page. Using the API can help you collate multiple page speed metric results for a bulk set of URLs. This helps us to track performance for some of our clients.
A great use of this data can be to display page speed results via Google Data Studio into a Dashboard. A very cost effective way of tracking page speed performance over time. Only downside is that there aren’t options for users to customise tests by certain factors such as location, browser or connection types.
Google Lighthouse
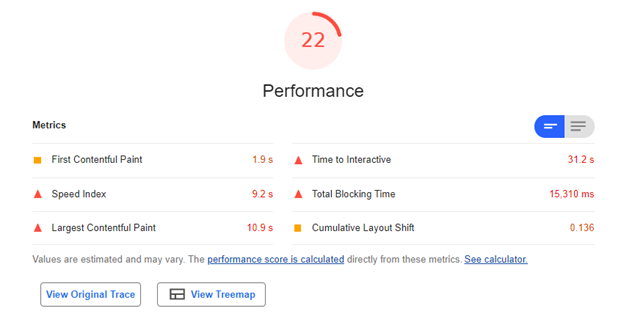
This tool helps our Technical SEO team here at QueryClick to sense check the specific offending files and requests being flagged. We sense check page speed metrics, such as LCP and CLS, in Chrome browser to identify performance issues and where they sit.
Usually by clicking on ‘View Original Trace’ or ‘Treemap’ allows us to access this information which splits out certain file types during the load of a page. Certain page speed metrics are flagged within this view in Google Chrome allow us to see when metrics are triggered.
For example:

This tool is great for when we are speaking with your performance-based stakeholders e.g. development teams and third-party tagging solution providers.
CrUX (Chrome UX Report) on Google Data Studio
Using this method we are able to share some great aggregated performance metrics for our clients, and potentially you, for real users of your website.
It’s very easy to set up and doesn’t require much effort (if any) to maintain the report. Simply open and check the dashboard over time.
With a lot of tools, including GTMetrix, the data is only “Lab” data. A Lab report is a simulated page speed test, whereas RUM (Real User Monitoring) is data collected from a real users.
The benefit here is that you get to see an aggregated view of all users of your website, which can be a plus point if you want a top level view of performance.
Lab data reports are great for conversations with developers. RUM data reports are great for marketing and performance based stakeholder conversations.
If you’re looking to get started building a Google Data Studio Dashboard using CrUX data, I recommend reading this article. It’s a simply process, basically putting in your domain and let Google Data Studio create the dashboard. Then you’re done.
Page Speed Case Study Insights
Over the past few years we’ve worked with a fair few clients to improve SEO performance through page speed optimisation. Here are few glimpses of how we’ve improved performance for our clients.
- CSS files
Optimisation: Removed redundant Reevoo CSS files site wide:Results:
• Shaved off 2.31 seconds off Time to Interactive metric, which is a performance gain of 34%.
• YoY we’ve seen a 5.4% reduction in Bounce Rate for our clients product pages, for mobile users via organic search. - Page requests
Optimisation: Reduced page requests site wide by removing 73 requests on average.
Result: Reduced Time to Interactive by 0.6 seconds.
- Built new website templates for greater page speed performance
Optimisations:
• Efficiently loaded files, such as images and JavaScript that were blocking page speed performance.
• Remove unnecessary CSS & JavaScript was loading above the fold halting progress for Users to see important visible content.
• Reduce image sizes above 100kb using compression & re-sizing images.Results:
• First Contentul Paint reduced by 71%.
• CrUX report now showing LCP metric improved sitewide seeing 92% of the website being in the ‘Good’ range, up from 80% YoY (+12%).
• Saw Server Speed for RUM data improve for total website from 51% to 70% performance better in the ‘Good’ range reported in CrUX.
I hope you found my guide useful. To quickly find out how your site speed stacks up, you can try our free page speed tool below.
If you’re looking to improve page speed performance for your website, feel free to get in contact with myself via email.
Is your site speed up to scratch?
Test it with your free page speed tool.
Own your marketing data & simplify your tech stack.
Have you read?
I have worked in SEO for 12+ years and I’ve seen the landscape shift a dozen times over. But the rollout of generative search engines (GSEs) feels like the biggest...
As you will have likely seen, last week Google released the March 2024 Core Algorithm Update. With it, comes a host of changes aiming to improve the quality of ranking...
After a year of seemingly constant Google core updates and the increasingly widespread usage of AI, the SEO landscape is changing more quickly than ever. With this rapid pace of...


