Performance Budgeting for Page Speed: Protect your ROI & User Experience

In this article we cover the different areas of performance budgeting and how to instil the benefits of it within your organisation.
- What is performance budgeting for page speed?
- A ‘down-the-pub’ explanation of performance budgeting
- Why does performance slip?
- The benefits of performance budgeting
- Page speed metrics you should use
- When to use performance budgeting in a business
- How to track and enforce performance budgets
- Rounding up performance budgeting
What is performance budgeting for page speed?
Performance budgeting sets maximum limits for specific page speed metrics. The purpose of the performance budgeting limits is to stop page speed metrics from declining after enhancements are made to protect ROI. All stakeholders should be involved, including design, marketing and development.
Page speed performance budgeting is high on the agenda for many businesses and the statistic below (courtesy of Deloitte) demonstrates why:
”From 0.1 seconds improvement in site speed we observed that retail consumers conversions grew by 8%.”
Source: Milliseconds Make Millions
A ‘down-the-pub’ explanation of performance budgeting
Imagine Dave*.
Dave wants to lose weight; his total calorie intake for the day is 1,200. But not all calories are equal are they, Dave? Dave has a limit of 20 grams of carbs for the day too.
Oh my, this is getting complicated!
But wait…
Dave has joined a program created by QueryClick whereby he has to track:
- His daily total calories (1,200 Kcal)
- His daily carb count (20 grams)
Whenever Dave goes over his two set budgets there’s an alert sent to QueryClick, who then discuss with Dave how to get back on track to meet his allowances.
And that’s it! A simple process of maintaining a set budget each day, week or month to achieve and maintain a specific goal.
*Dave is a fictitious person, and QueryClick do not have any dealings with any weight loss programs, only page speed performance and performance budgeting programs, but you get the idea.
Why does performance slip?
Website performance can degrade, especially if performance budgeting is not in place.
There are a few factors that go against the grain of maintaining and improving page speed performance:
- The web keeps getting bigger. Pages are growing, e.g. use of JavaScript frameworks
- Lack of performance monitoring and budgets
- Lack of communication between stakeholders
- Lack of post development release testing & refinement
The benefits of performance budgeting
The benefits of performance budgeting are far-reaching, but here are a few of the key upsides:
- Leads to better communication between designers, marketing and developers
- Allows businesses to proactively consider performance, and not reactively clean up the website to resolve performance issues post implementation
- Emails alerts are set in place if issues do arise
- Highlights the value of page speed to everyone involved in your business. Speed equals money!
Page speed metrics you should use
Google recommends using a range of metrics to track your page speed, which tie into performance budgeting nicely.
Google’s Page Speed Insights tool offers:
Speed metrics are measured in seconds, which usually include how quickly pages load from server, visually load and interactivity times. See below for a sample of the various metrics that are used when measuring page load.
- First Contentful Paint is the point when the browser renders the first bit of content from the DOM, which may be text, an image, etc.
- First Meaningful Paint is when a user sees content that makes sense and is nearly ready to start interacting with the web page.
- Time to Interactive is the time in which it takes for users to start interacting and using a web page.

Most recently Google introduced Web Vitals, which are additional criteria used to measure web page speed performance.
Web Vitals include the below metrics and you can check them out in greater detail here.
- Largest Contentful Paint: Measures loading performance in seconds.
- First Input Delay: Measures the time it takes for the user to interact with a web page.
- Cumulative Layout Shift: Measures visual stability of elements loading on a web page.
Quantity-based metrics are simply the total amount of requests that are loading on a webpage and the page weight (measured in MB). Less is more and this is a great initial indicator of how much a page can be reduced to improve page speed performance.
Below is an example of Pingdom’s page speed tool highlighting the number of requests and page weight.


Note that page weight can be split into file types, which can help audit and monitor how heavy (in MB) certain elements of a page are.
This is beneficial as certain business stakeholders are responsible for specific elements of a web page. For example, images might be owned by content producers or JavaScript is likely to be owned by developers or third-party providers.
Rules can be used to measure performance too. Google Page Speed Insights has its own score out of 100, which scores web page performance based on set criteria. Yahoo also has its own score, which you can access via the GTMetrix tool.
Tip: Just to point out, it’s worth tracking metrics for different device types, i.e. both desktop and mobile. Within the realm of mobile devices, you could potentially track different mobile device brands or connection type (3G or 4G) in which visitors most commonly visit your website.
To give you an idea of the metrics, here are some example budgets that you can put together for your website.
- Time to Interactive: less than 3 seconds
- Total Image size in KB: less than 500kb for mobile devices
- Google Page Speed Score: Average of 85 for all mobile pages throughout the website
When to use performance budgeting in a business
The most common scenarios in which you can capitalise on using performance budgeting include:
- Website re-builds / re-designs
- Page speed optimisations of first-party files e.g. JavaScript or images
- Third-party optimisations e.g. removing and enhancing loading of tracking tags (Maxymiser, Optimisely, Reevoo, etc.)
- Managing content changes and new pages generated on a website
- UX design updates
- Monthly development sprint cycles
As you can see, all the above scenarios involve conversations with various teams within a business and can also spark conversation with third-party suppliers and agencies.
Below is a step-by-step process for taking a set of calculated performance budgets and integrating them into your business.
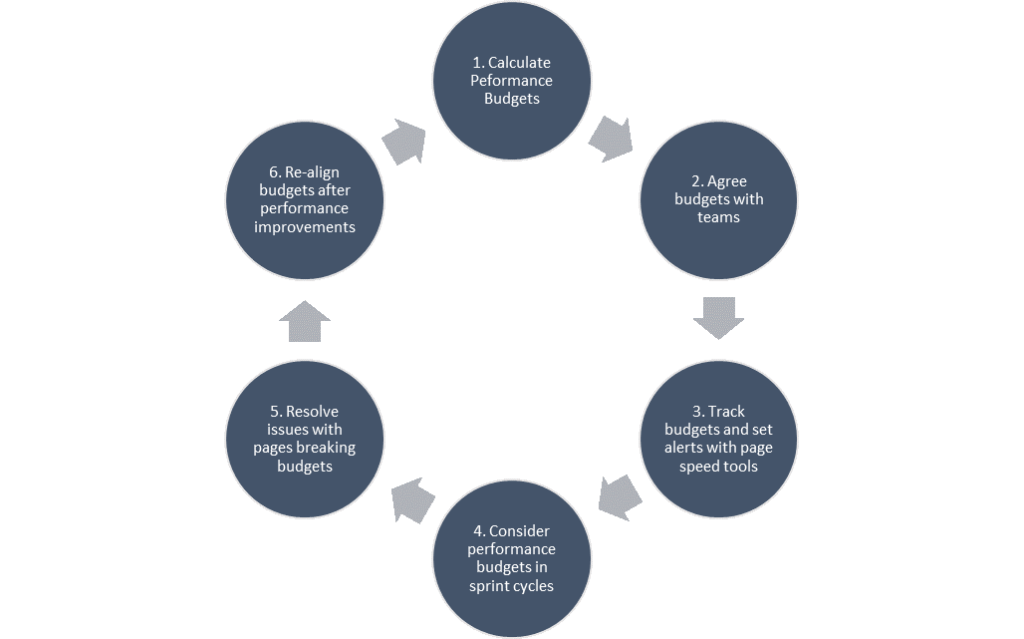
- Calculate performance budgets for the website
Extract key performance indicators (KPIs) from the company vision and set realistic, measurable targets from them. For example: “Load and get interactive in 5s”.
Calculating page speed budgets involves some form of bench-marking against competitors and knowing where your website currently stands in terms of performance.
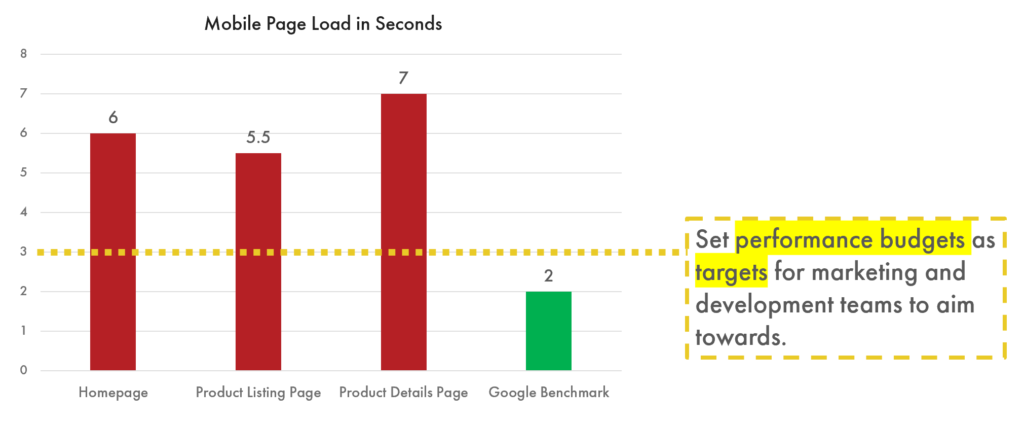
Tools such as Page Speed Insights, GTMetrix, Webpagetest.org, Calibre, SpeedCurve and Pingdom can all assist in gathering the metrics that you need to calculate budgets.
An awesome technique is benchmarking competitor websites using the film visual comparison tool by Webpagetest.org. Here’s what it looks like:

Another method is to utilise calculator tools to figure out how fast a website should be on a specific connection. From there the content breakdown size in KB is then calculated, giving you content file type budgets for a page or website.
The performancebudget.io website calculator is a popular tool and is easy to use.
For example, you’ve already calculated that loading a page within 6 seconds on a 3G Fast 1.6Mbps connection is what you desire. This calculator shows what the content file breakdown will look like (which can be adjusted for real-world websites as this is only a calculator).
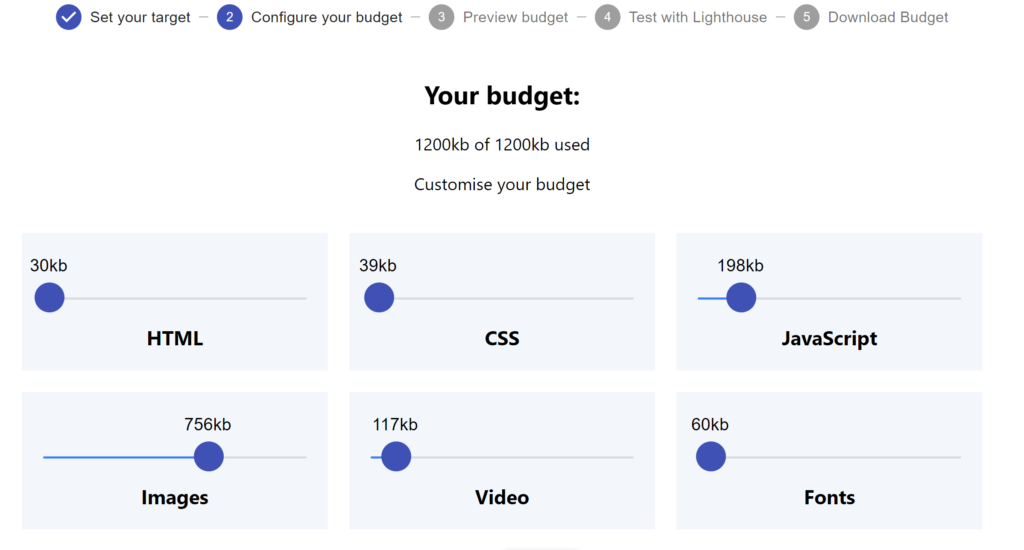
Another tool that can be used is the Chrome extension called ‘Browser Calories’. See here for the extension.
- Agree and sign off performance budgets with internal and external stakeholders
Setting performance budgets isn’t simply for the techies in the business. The process of setting budgets involves various teams collectively moving towards a common goal and KPI.

Agreeing on performance budgets as a collective is crucial, as there needs to be buy-in from everyone.
- Set the limits in a tracking software tool to alert stakeholders
Making the theory of performance budgeting come alive requires speed tracking tools such as GTMetrix, SpeedCurve or Calibre.
Different tools track Real User Metrics (RUM) or Synthetic “Lab” Metrics.
RUM tracks real users in real time, giving you the page speed data of users’ actual web experience. The data collected can be broken down by the devices, locations, and browsers that people are using to distil performance bottlenecks based on these variables.
The goal is to reveal real user interactions via analytics data meshed with page speed performance, potentially after design or functionality changes to the website.
Synthetic data tracks page speed-related metrics, the same as RUM, but sporadically testing at intervals as “lab” tests.
The goal of this type of testing is to reveal and debug loading issues in UAT and live environments at page level. Performance budgets and alerts can be set for this type of data too.
- During each development cycle, performance budgets need to be considered to mitigate any impact to budgets and therefore performance
Thinking of performance as a design feature and not a technical feature can really change mindsets.
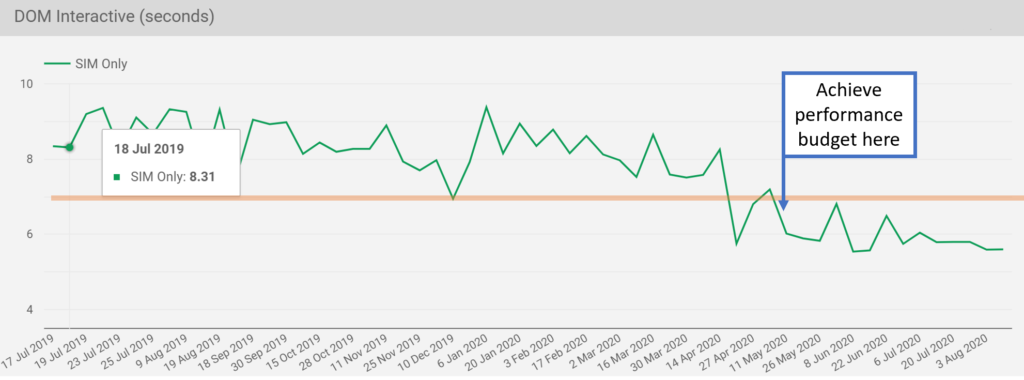
Sometimes it’s best to visualise data to highlight where current performance is against your existing performance budget. At QueryClick we’ve created our own Google Data Studio dashboards to help our clients understand whether performance has reached the budgets or not.
- In the event of an emergency, discuss with relevant teams as to why certain pages have over spilled on budget and rectify those issues back in line with the budget
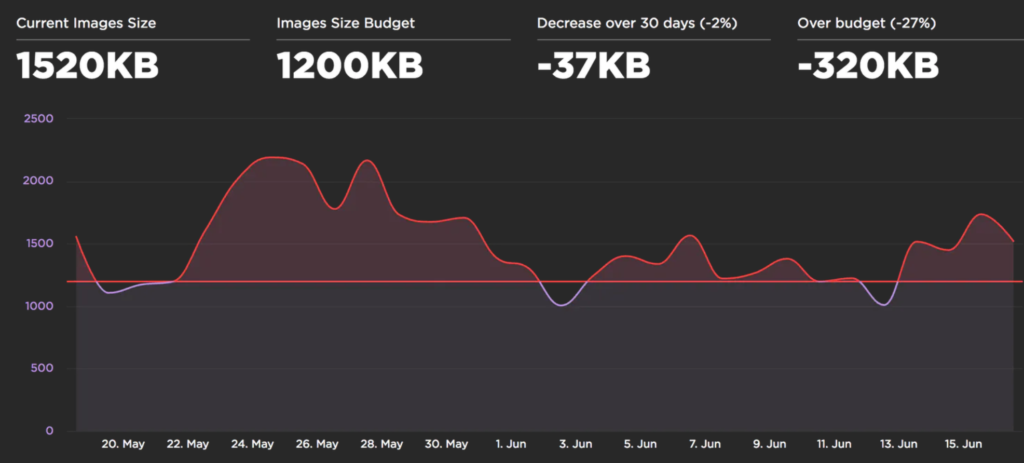
The performance budget graphs can work both ways and not just highlighting when performance has improved.
Here’s an example, from SpeedCurve, of what it looks like when a budget has slipped back over the budget line. Using this sort of visualisation can trigger discussions with the relevant teams to rectify issues.
- Re-align and set new budgets in line with performance enhancements to the website
It’s worth pointing out that new performance budgets can be set once performance has improved.
How to track and enforce performance budgets
The tools that you can use to track and add alerts do vary, especially in price, but still follow the same principles. Below are the tools that we use (or plan to use) at QueryClick.
- GTMetrix
- Calibre
- Webpagetest.org
- Page Speed Insights
- SpeedCurve
- Pingdom
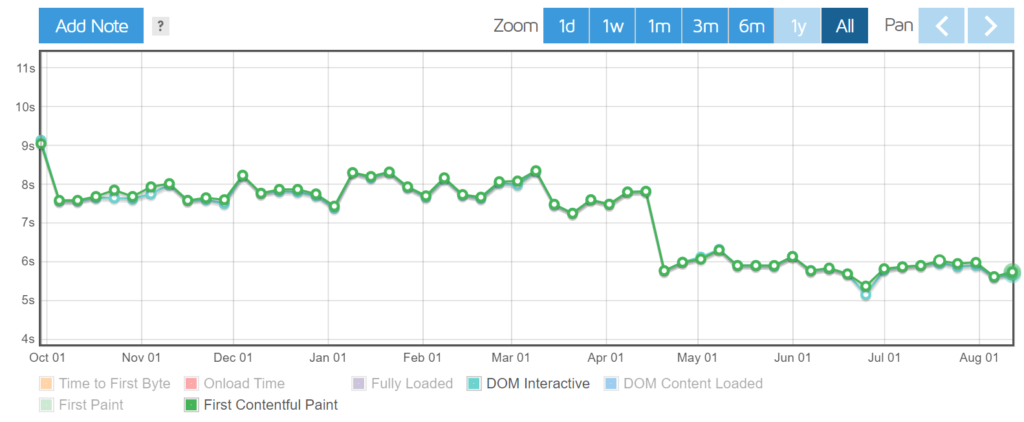
Here’s what it looks like when we use GTMetrix performance budget and alert setting:

The daily or weekly testing schedule provides a great platform for reporting performance over time. This process ties into performance budgeting very well too.
Rounding up performance budgeting
Remember – to protect your page speed & ROI, don’t be this graph…
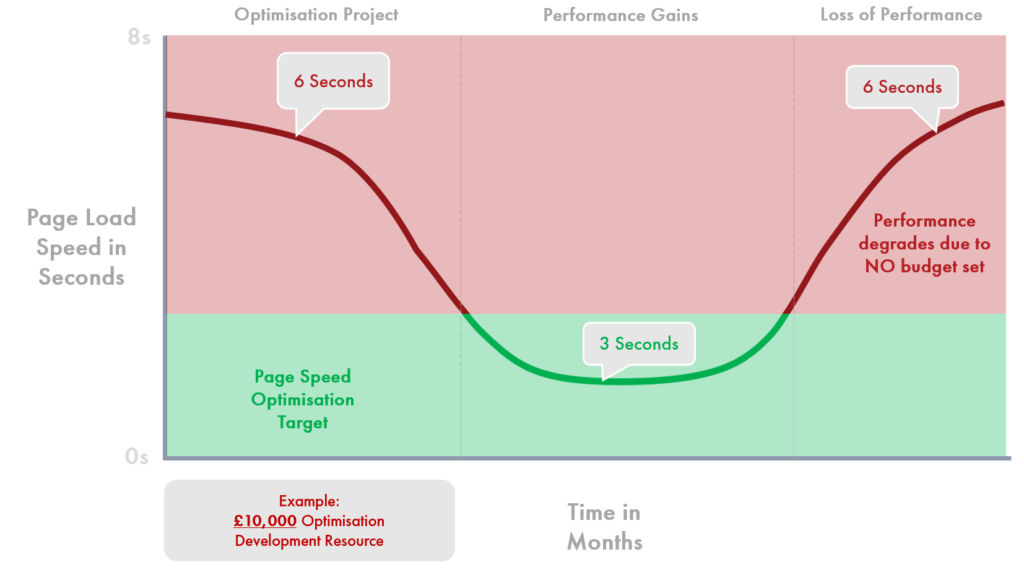
Be this graph!

Get a mini-page speed audit from QC today!
We are currently offering mini-page speed audits, assessing 5 URLs on your website.
The aim is to help you quickly identify low hanging fruit to improve your website – the 20% causing 80% of your website’s page speed performance issues.
Contact us now for a page speed audit!
Own your marketing data & simplify your tech stack.
Have you read?
I have worked in SEO for 12+ years and I’ve seen the landscape shift a dozen times over. But the rollout of generative search engines (GSEs) feels like the biggest...
As you will have likely seen, last week Google released the March 2024 Core Algorithm Update. With it, comes a host of changes aiming to improve the quality of ranking...
After a year of seemingly constant Google core updates and the increasingly widespread usage of AI, the SEO landscape is changing more quickly than ever. With this rapid pace of...


