A Comprehensive Guide to Attribution Models

In an environment where customers are increasingly taking more complex and extended journeys – and using more devices on those journeys – the need to understand the specific impact of the wide range of media at your disposal is paramount. Which is why attribution matters.
But how do you go about selecting a marketing attribution model that works for you?
That can be challenging. So, we thought we would create a comprehensive guide to help you with the process.
One of the key things to understand about attribution models is that there isn’t a definitive, one-size-fits-all answer for everyone. And, in practice, identifying which model is right for your brand or your business is going to be impacted by a range of different factors from the stage, scale and maturity of your marketing activity to how much time, budget and effort you are able to apply to it.
So let’s begin our whistle-stop tour of each attribution model in turn:
- First-touch
- Last-touch
- Linear
- U-shaped
- Time decay
- W-shaped
- Data-driven
- Media mix modelling
- Probabilistic modelling
What attribution models are available to marketers?
Single-touch attribution
These models are relatively simple, and work on the basis of allocating 100% of the credit for a revenue conversion or other customer behaviour to a single touchpoint with the customer, either at the beginning or the end of the customer journey. All other touchpoints in between are ignored for attribution purposes.
Works well where – You have a simple funnel environment with very few marketing activities. And businesses who are scaling from a low base may well employ them early in their growth.
Possible limitations – However, they oversimplify and ignore the impact of multiple touchpoints on complex, longer customer journeys.
There are two types of single channel models – First and Last-touch attribution:
First-touch attribution
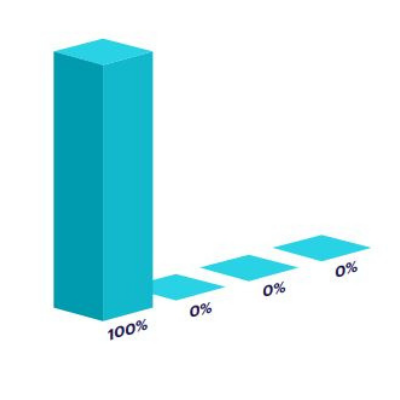
Built around the premise that the first touchpoint with the customer is the crucial determinant in a customer’s decision to do business with you.
So, 100% of the credit for revenue is directly attributed to the first interaction in the customer journey. For example, if a customer comes in on an eBook download it gets all of the credit – regardless of all the other touchpoints in between that and the sale.
Works well where – Where you have a simple, early stage marketing model that is heavily focused on growth and quickly scaling your business. And where there is a strong focus on growing top of funnel.
Possible limitations – However, it is going to be much less appropriate where you have a lot going on in your marketing funnel and a more complex and extended buyer journey (of 90 days plus).
Last-touch attribution
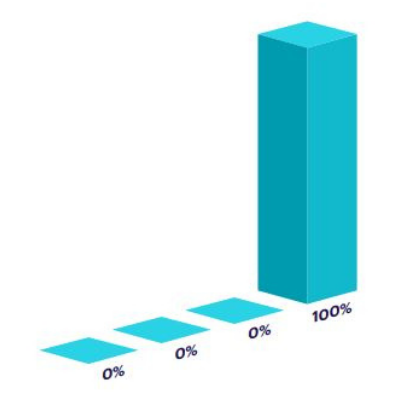
Similar to first-touch attribution, last-touch is predicated on allocating 100% of the credit for conversion to a single touchpoint.
However, in this case it allocates credit on the basis of the last touchpoint prior to purchase or revenue. And similarly, it gives zero credit to other interactions along the way.
Works well where – You have a heavy focus on optimising conversion at the bottom end of the funnel.
Possible limitations – But again, it’s going to be much less appropriate for analysing longer and more complex journeys accurately.
So, taken together, single channel attribution models do have their benefits – and you may well start your journey using them in early growth stage scenarios in smaller businesses – but it is also highly likely that even an initial spurt of growth will see you outgrowing their usefulness. As your marketing evolves and matures your need for more sophisticated attribution is likely to follow suit.
Read more: Last Click vs. Corvidae – Solving the Attribution Problem
Multi-touch attribution models
Multi-touch marketing attribution models take a broader view of attribution and attempt to place a relative value on the impact of all touchpoints across the customer journey. Although, these are weighted differently depending on the model you select.
If you are operating with a more complex model, longer cycles and a multitude of channels it’s likely that this is where you find yourself gravitating to.
Let’s take a quick look at each of the commonly used multi-touch models:
Linear

Very often you don’t want to give single channels or campaigns all the credit for conversion and a Linear model moves the principle on by applying equal weighting and credit to all contributing touchpoints.
Works well – Where you are looking to measure a campaign holistically and get a feel for the customer journey, including seeing which channels contribute across it.
Possible limitations – Where you already understand the customer journey and have a more detailed need to dig into the data on individual channels. To understand which ones are critical so you can focus your effort on them.
U-shaped
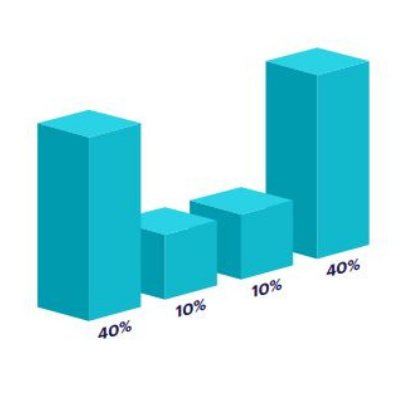
Takes the view that some touchpoints have more influence on the way to conversion than others and scores them separately.
Here, first touch and lead conversion matter most and are both heavily weighted with 40% of the credit being applied to each. While the remaining touchpoints are given an equal share of the remaining 20%.
Works well – Where you are looking to identify what drives channel acquisition or have heavy focus on nurture.
Possible limitations – If you are using Google Analytics but have a buying cycle that extends over 90 days you can potentially lose the data view you need.
Read more: 5 Things You Need From Your Attribution Solution That Google Analytics Can’t Do
Time decay
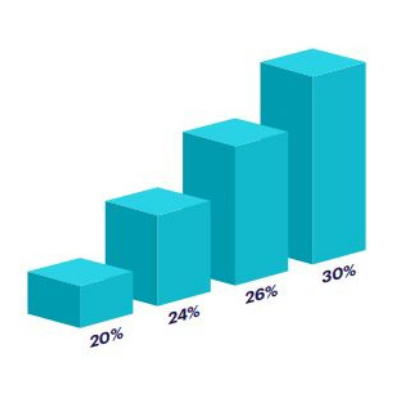
A time decay attribution model weights each touchpoint differently and is driven by the assumption that touchpoints closer to sale should get more credit. The assumption being they have a heavier impact on conversion as the buyer moves down the funnel.
Works well – With a short sales cycle less than 90 days and if you are looking to identify what drives conversion in the lower funnel.
Possible limitations – Not so appropriate for longer B2B customer journeys where it ignores the fact that customers can make important decisions earlier in the process.
W-shaped
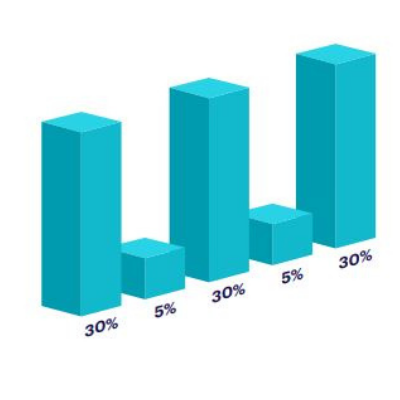
W-shaped attribution models are an extension of the U-shaped model with the addition of weighting for the opportunity stage.
Here, first-touch, lead conversion and opportunity creation share 30% credit each, with 10% being shared out between the other touchpoints.
Works well – Where you are looking to identify touchpoints at the 3 critical points that help you build audience, create leads and then drive to conversion.
Possible limitations – If you are using Google Analytics but have a buying cycle that extends over 90 days you can potentially lose the data view you need.
Custom attribution models

This is where you take the view that you need a very personalised view for your marketing needs.
And the discussion here opens up into a wider consideration of more complex marketing attribution models that include Statistical or Data-Driven Attribution, Media Mix/Econometrics Attribution and Probabilistic modelling.
Which we take a look at in turn below:
Statistical or data-driven attribution
Increasingly marketers have access to ‘data-driven’ models which essentially apply channel attribution rules that are determined by the data available to them. Instead of rules-based assumptions about channel mix, data-driven models determine the model’s weighting based on existing data.
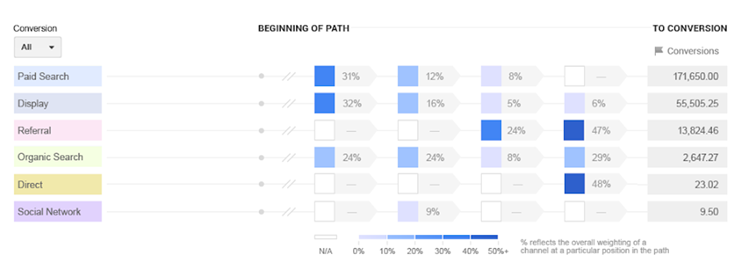
Even the free version of Google Analytics now offers this functionality, and it is increasingly available in digital ad tech like Google Ads.
Works well – Can give an understanding of the contribution of channels that are typically poorly served by Last-click – Paid Social in particular – in your marketing mix. As an overall measure of volume of interactions.
Possible limitations – Data-driven channel attribution in GA and Adobe suffers from data quality challenges. Which can inaccurately represent the individuals behind the clickstream. And so, the data-driven models are showing only part of the real picture.
Media Mix Modelling (MMM) / Econometrics based attribution
This approach applies statistical techniques to attempt to find incrementality – or the measure of the lift that marketing spend provides to conversion rate, and ultimately revenue – by looking at large data sets using mathematical techniques. And often relying on integrating panel data for offline activity.
In all cases, the object of MMM or Econometrics is to isolate a test case that is to be measured when it is applied in two or more variations. And the outcome is often expressed as a measure of ‘incrementality’ to aspects of the media mix.
For example, a business may ask what the cost per acquisition is associated with using an offline catalogue.
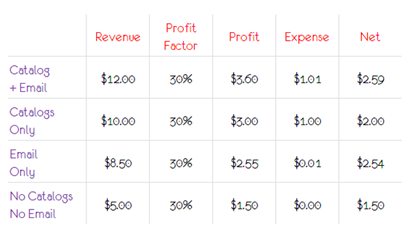
This modelling approach is then used to analyse different mixes of media channels, cohorts of customers and overall acquisition outcomes (using a mix of variations including use of catalogue only, catalogue plus some marketing channel, the same channels with no catalogue etc).
By comparing the results of these variations, an overall value can be determined for the incremental acquisitions made thanks to the catalogue itself – which can then be enriched with data about cost of delivery, operational cost, marketing costs etc. Which can be used to determine incrementality or uplift associated with various media types.
Works well – Can be used where be used to answer a particular question for a particular time period. And potentially used infrequently to inform overall strategy
Possible limitations – Due to the complexity and volume of data required to create balanced tests and models that are statistically sound, media mix and econometrics studies done correctly are an expensive, ongoing proposition. That should only ever be run in parallel to attribution activity that is intended to allow tactical optimisation day-to-day
Probabilistic modelling
Recent advances in Machine Learning and cheap deployment in SAAS architectures have allowed probabilistic data processing to be applied to data challenges in marketing day-to-day.
For example, Google Analytics uses Shapley Modelling for their data-driven channel models. This is based on Game Theory, and approaches marketing as a game, where each channel is a player in the game, and the set of all players/channels can be seen as though working together in order to drive the conversions.
A very broad brush explanation of a typical Shapley approach is to find an average incremental value for a particular channel touchpoint by looking at all conversion paths that exist.
Another common model is a Markov Chain model. Markov Chains are named after the mathematician Andrey Markov, and in essence, enable modelling a sequence of events in which the probability of each event depends only on the state attained in the previous event.
Practical application of the Markov Model can be powerful. Particularly when you are interested in channel level attribution.
Let’s look a practical example. In the case below, a Markov Chain based approach was used in conjunction with QueryClick’s Corvidae platform to assess and more accurately attribute revenue contribution by channel for a well-known Online Fitness retailer.
As you can see below. Compared to Last Click Non Direct (the rules based model used by GA 360 and Adobe by default), channel attribution has changed by £39.9 million.
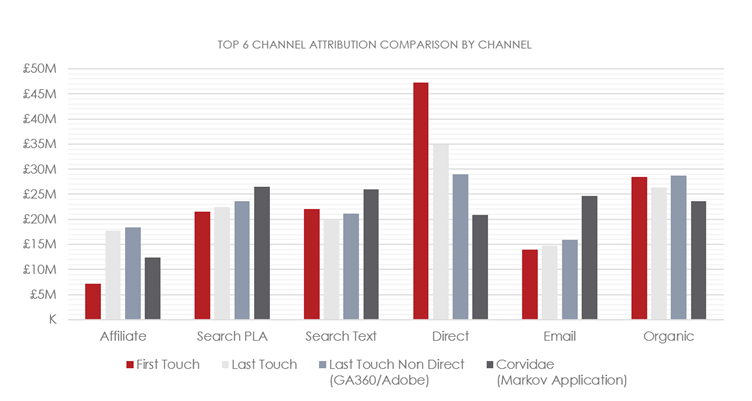
Given total turnover is only £136.7m across the measured channels, this radically alters the ROI implications of media spend, particularly in Paid Search and PLA (Paid Search Shopping Ads).
Works well – Can be powerful in scenarios where you are interested in channel level attribution and can combine them with sophisticated attribution software.
Possible limitations – they must be re-modelled to provide more granular outcomes than just channel attribution. Which is computationally very expensive – and which also causes these models to run into data volume limits which prevent their practical functioning.
That concludes our guide to some of the main attribution models.
As you will have gathered, these models can work well in certain situations but also each have their limitations. And much of these stem from their lack of capability to understand the engagement an individual visit has – and that individual’s probability to convert at each individual stage of their own, unique conversion path.
This has led to the emergence of a new approach called Visit-Level Attribution.
A new approach to attribution: Visit-Level Attribution
Advances in technology have made this a reality.
It is now possible to take an approach that learns from econometric modelling techniques but is focused on providing near-live data for tactical marketing insight using bleeding edge data science.
By building powerful visit-level attribution data you are able to unravel the complexity of the wide variety of touchpoints on individual customer journeys and accurately attribute the correct level of impact to each.
This is the approach being taken my leading edge attribution platforms like Corvidae. To learn more about this type of approach, download a copy of our eBook below.
What is Visit Level Attribution?
Own your marketing data & simplify your tech stack.
Have you read?
I have worked in SEO for 12+ years and I’ve seen the landscape shift a dozen times over. But the rollout of generative search engines (GSEs) feels like the biggest...
As you will have likely seen, last week Google released the March 2024 Core Algorithm Update. With it, comes a host of changes aiming to improve the quality of ranking...
After a year of seemingly constant Google core updates and the increasingly widespread usage of AI, the SEO landscape is changing more quickly than ever. With this rapid pace of...


